
Connecting computer vision to a dashboard
Baztech’s student teaching experience includes a glove-detection application using Intel OpenVINO and a Node-RED dashboard. The session introduces how camera-based detection can connect to a visible application interface.
The setup runs on a fanless Intel i7 industrial PC with a Logitech camera. OpenVINO supports the vision processing, while the Node-RED dashboard presents the detection result for students to observe.
A practical learning example
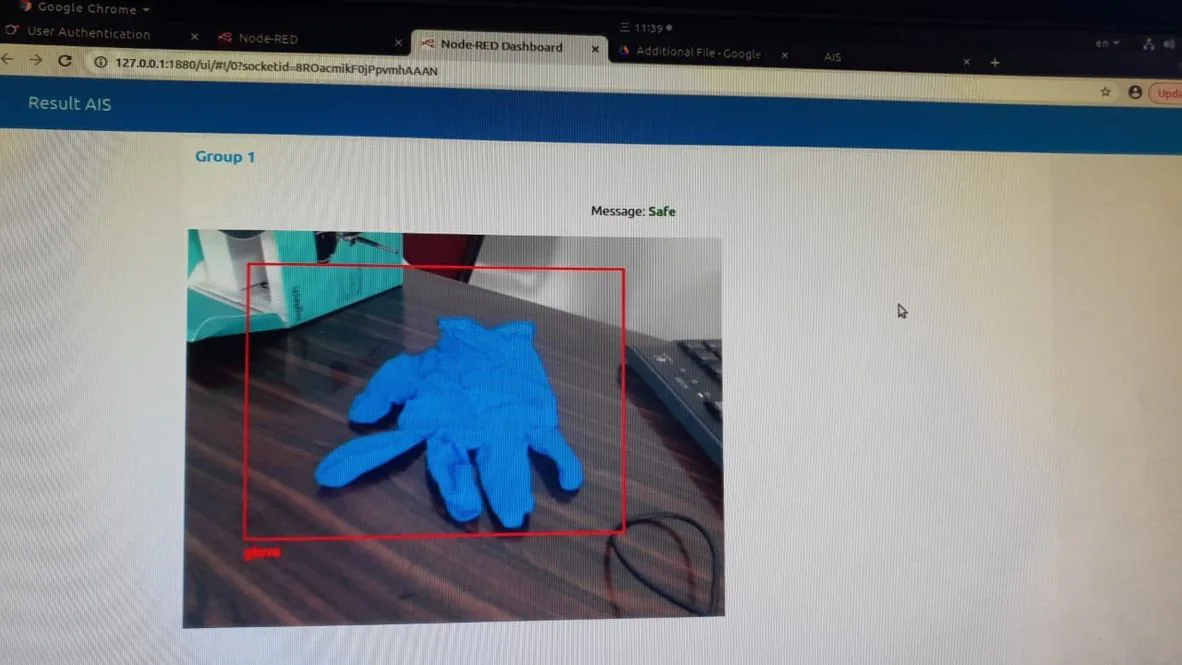
The supplied photograph shows the Node-RED dashboard displaying a blue glove, a detection bounding box and a status message. This provides a concrete example for discussing how a camera image, detection output and dashboard presentation fit together.
The displayed status is part of the teaching demonstration, helping students relate the detection output to a dashboard message.
Node-RED as an application integration tool
We find Node-RED useful across many applications. In this teaching example, it provides the dashboard layer around the vision output, helping students connect the processing work to an interface they can view.
For a similar training session or vision integration project in Malaysia, share the learning objectives, camera setup, detection task and intended dashboard. These details help define the learning activities and integration scope.
Questions about this integration
What was the teaching application?
Students were introduced to a Node-RED dashboard for glove detection using Intel OpenVINO.
Which hardware runs the application?
The described setup uses a fanless Intel i7 industrial PC and a Logitech camera.
What does Node-RED do in this example?
Its dashboard displays the vision detection output as part of the teaching demonstration.